The Public Humanities Hub Okanagan gave out five Impact Awards in 2020 with the objective of stimulating humanities research that engages the public. With this funding, UBC Okanagan professors, Dr Neha Gupta (CCGS) Dr Fatemeh Fard (CMPS), Dr Eric Kansa (Open Context) and graduate student Mohammad Hadi have developed a project entitled Interactive Visualization of Digital Archaeological Collections on Open Context. They are working to develop tools for navigating and exploring digital archaeological collections on Web-based platforms.
Digital tools are necessary to engage the public with archaeology and to promote deeper understanding of archaeological data amongst descendent communities. At the same time, development of digital tools can encourage archaeologists to re-use digital collections, and build capacity in digital archaeology. These efforts, in turn support Canadian federal and provincial commitments to the United Nations Declaration on the Rights of Indigenous Peoples and Indigenous peoples’ right to their digital heritage.
Imagine a massive digital music library that you own, and that you can search within it by artist name and date of release. This is useful when you know the artist name or the year they released an album. But what if you want to hear a specific song – you know the tune but cannot remember who sang it or when. How do you search for that song or for similar tunes? Open Context is like a giant library that has lots of great archaeological information but we have limited ways to examine things or patterns of things within it.
For example, Open Context has an interactive map-based visualization that shows us how big is each collection based on the number of records. A time slider allows us to filter collections based on date or chronology. While useful, this way of examining Open Context does not tell us about what is in one collection such as specific motifs and decoration techniques on pottery or the rich and complex history of artefacts documented during excavations. So the team set out to make a digital tool that shows us information in Open Context, and lets us examine patterns in one collection or dataset.
Creating a well-documented digital tool involved four phases (Figure 1), namely:

Figure 1. Overview of phases for creating a visualization tool for the Poggio Civitate dataset in Open Context. (Gupta 2020)
- identifying an interesting archaeological dataset in Open Context and select a specific archaeological category like pottery motifs and decoration techniques for further investigation;
- developing a process to get pottery information from Open Context into a spreadsheet-like program;
- creating a digital tool to analyze archaeological artefacts and categories;
- probing visualizations in terms of potential insights into the archaeological dataset
The team decided to focus on one dataset that had interesting archaeological artefacts, with rich descriptive information, names and terms used in archaeology. We chose Anthony Tuck’s Poggio Civitate dataset (2012) from Murlo, Italy. We were thrilled to bring Dr Tuck (UMass Amherst) into our research meetings. Dr Tuck is director of excavations at Poggio Civitate, with 30 years of familiarity with Etruscan archaeology and the history of data documentation practices at the site. Dr Tuck has brought invaluable insights into the names and terms archaeologists used to describe pottery motifs and decoration techniques.
We came to a key decision regarding documentation of our process. We agreed that we would utilize an application called Jupyter Notebooks because we can easily share our code, documentation and visualization tool.
In Phase 2, the team developed a step-by-step process to pull relevant records from the Poggio Civitate dataset, and put these data into rows and columns much like a spreadsheet (Figure 2). Dr Kansa wrote code for this step, which is available here.
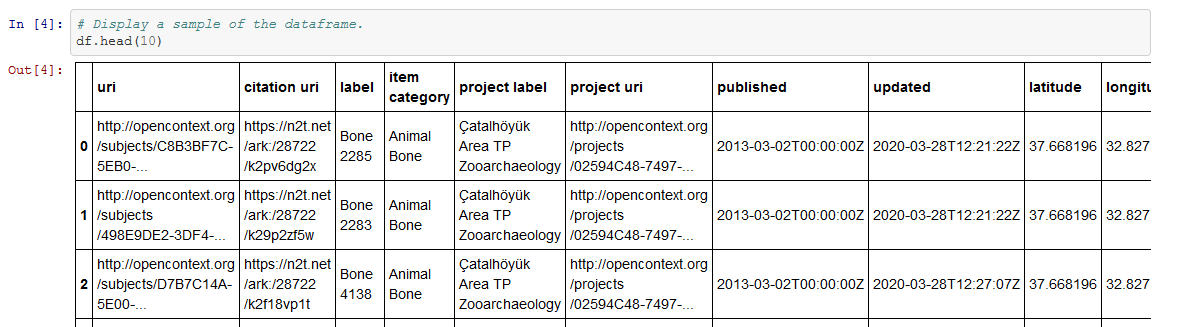
Figure 2: A Pandas Dataframe populated with data from Open Context (Kansa 2020)
Unlike a conventional spreadsheet, a Pandas DataFrames in Jupyter Notebook allows us to document each step to pull, filter, and analyze data. This means that if we make a mistake, we can quickly go back to the code and find the problem to fix it. This also means that if another researcher wants to reuse the notebook for another analysis, they have documentation and code as a guide.
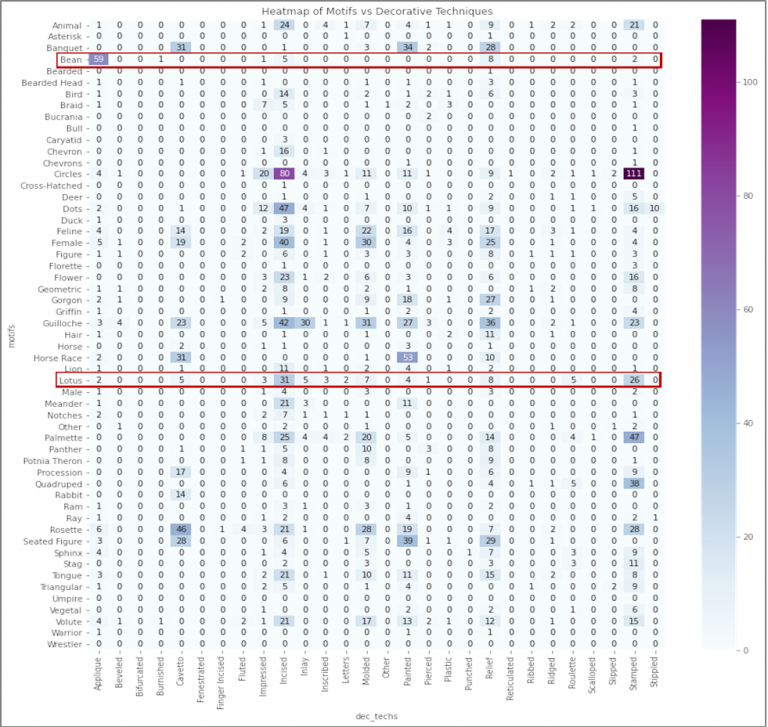
Figure 3. 2D heatmap of co-occurrence of motifs and decoration techniques with respective counts and colour range on right. Motifs ‘bean’ and ‘lotus’ are highlighted (Hadi 2020).
Once we have the pottery information in rows and columns, we can use the table to transform data in different ways and create visualizations. In the Poggio Civitate dataset, we were interested in examining the co-occurrence of motifs and decoration techniques on pottery. To do this, Mohammad created subsets for label, motif and decorative techniques and used the count function to calculate the number of times that each motif occurred on each decoration technique. In this case, we examined the counts or occurrence as a ‘heatmap’, where the darkest shade on a colour range represents the highest count of occurrence (Figure 3). The heatmap has a colour range from light blue (lowest occurrence) to dark purple (highest occurrence).
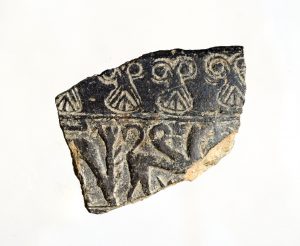
Figure 4. Image of a lotus motif from the Poggio Civitate collection. Three partial and one full lotus palmette are visible in the upper register of the pottery fragment. (Tuck 2012)
With the heatmap, we readily saw how pottery was described in the collection and patterns in the dataset. Dr Tuck helped identify problematic names and terms used in the dataset. For example, he pointed out that the motif ‘Bean’ might be merged with ‘Lotus’ which was an important iconographic symbol in Etruscan culture (Figure 4).
We have learned that visualization research relies on, and benefits from going back and forth between the patterns we see and questioning what these patterns mean and represent. It is in this back-and-forth process that we raise further questions and deepen our understanding of the Poggio Civitate collection.
Mohammad is currently working on developing a dynamic visualization from the Poggio Civitate collection. We look forward to presenting our visualization tool at the Public Humanities Hub conference in June 2021.
About the research team
The research team is Dr Neha Gupta (CCGS), Dr Fatemeh Fard (CMPS), Dr Eric Kansa (Open Context), and Mohammad Hadi, a graduate student in Computer Science at UBCO. As a result of Covid-19 restrictions on campus-based research, the team held its meetings virtually and we have been working remotely throughout the summer. They have made significant progress toward creating a ‘digital output’ based on digital archaeological collections. Mohammad’s digital tool and his documentation is available here.
Bibliography
Anthony Tuck. “Murlo”. (2012) Anthony Tuck (Ed.). Released: 2012-07-06. Open Context; DIO; ARK (Archive)
Anthony Tuck. “19990051reshoot.jpg from Italy/Poggio Civitate/Tesoro/Tesoro 26 North/1999, ID:364/PC 19990051”. (2012) In Murlo. Anthony Tuck (Ed.). Released: 2012-12-28. Open Context; ARK (Archive).
Figure 1 icons
“coding” by KonKapp, “Data Matrix” by Yarden Gilboa, “infrastructure” by Yamini Ahluwalia, and “people” by Humantech from the Noun Project, Accessed August 2020.